AI brand perception software with API and MCP access
For data and BI teams: how to get AI brand perception data into a warehouse, Looker Studio or an AI assistant, with per-plan API limits and what rival vendors publish.
Perception data that lives only in a vendor dashboard ends up in screenshots pasted into slides. A data team wants it somewhere it can be joined: sentiment by engine next to pipeline by region, theme scores next to NPS, AI-referred conversions next to paid search. That means an API, a BI connector, or at the very least an export that doesn't need cleaning by hand every week.
This guide is for the analysts and BI engineers asked to "add AI search" to a reporting stack. It covers which perception metrics are worth pulling, the access routes Promptwatch publishes with their plan limits, what other vendors in our catalog publish, and the questions to settle before signing.
Decide what you're pulling before you pick a route
Not every number in a perception tool belongs in a warehouse. The ones that do are the metrics with stable definitions that you can trend and join. Promptwatch documents six core metrics, and its Academy page on them is worth reading before you design a schema.
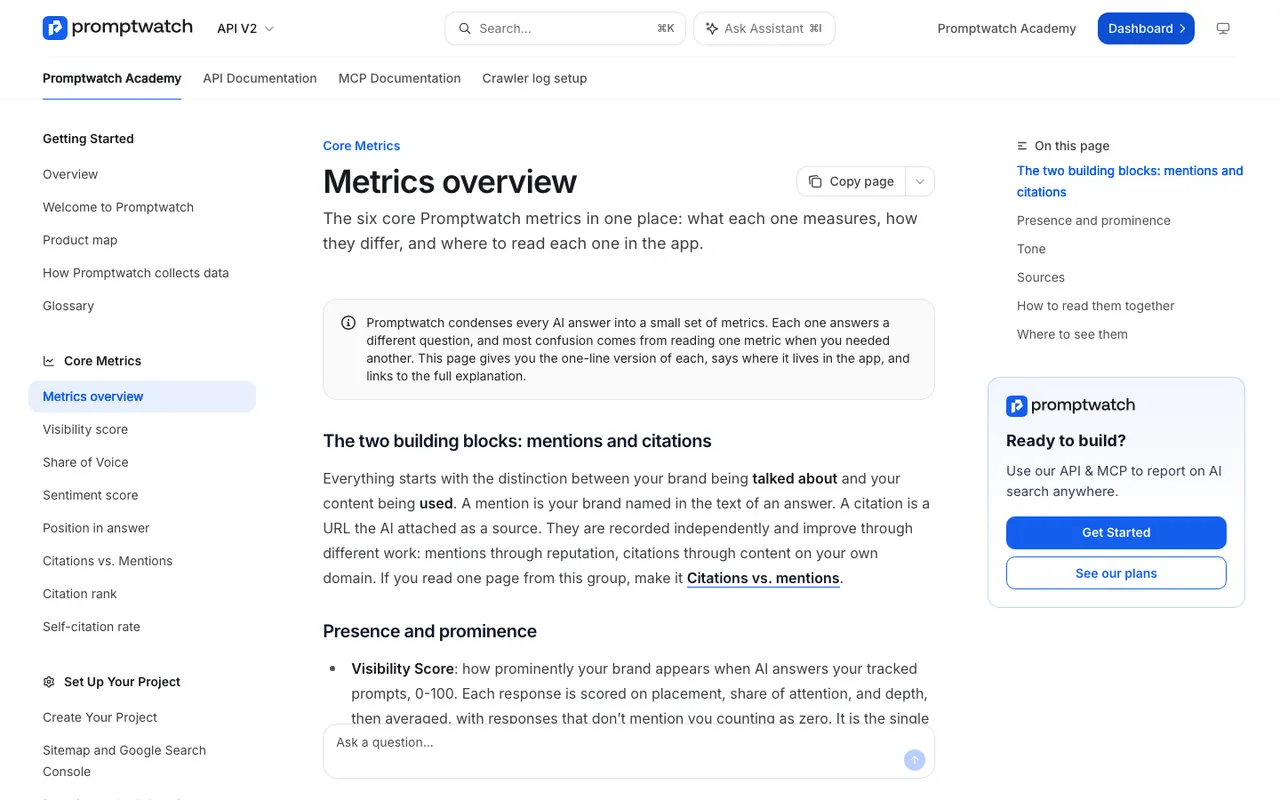 Promptwatch Academy's Metrics overview page, captured November 14, 2026.
The six split into three groups. Presence and prominence: Visibility Score (0 to 100, with answers that don't mention you counted as zero), Share of Voice and Position. Tone: the sentiment score, on a 100-point scale where about 50 is neutral, with thin mentions left unscored instead of counted as neutral. Sources: citation rank and self-citation rate.
Two definitions trip up data teams. Share of Voice depends on which brands are in scope (your direct competitors or every detected brand) and how many the chart shows, so store the scope with the value or the numbers won't reconcile. And the sentiment headline in the app is the most recent daily average from the last 30 days, which differs from a simple average over your date range. Pull daily values and aggregate them yourself.
The perception layer above those metrics is claim-level: Brand Narrative's themes and quotes, and Fact Check's outcomes and accuracy score. Those are the richest data for perception work. Whether they're exposed through the API isn't stated in the documentation we read, so confirm it with Promptwatch before you plan a claims table in your warehouse.
The access routes Promptwatch publishes
Promptwatch lists its integrations on one page, grouped by what they do: crawler log sources, CMS publishing, search and SEO data, and agent access.
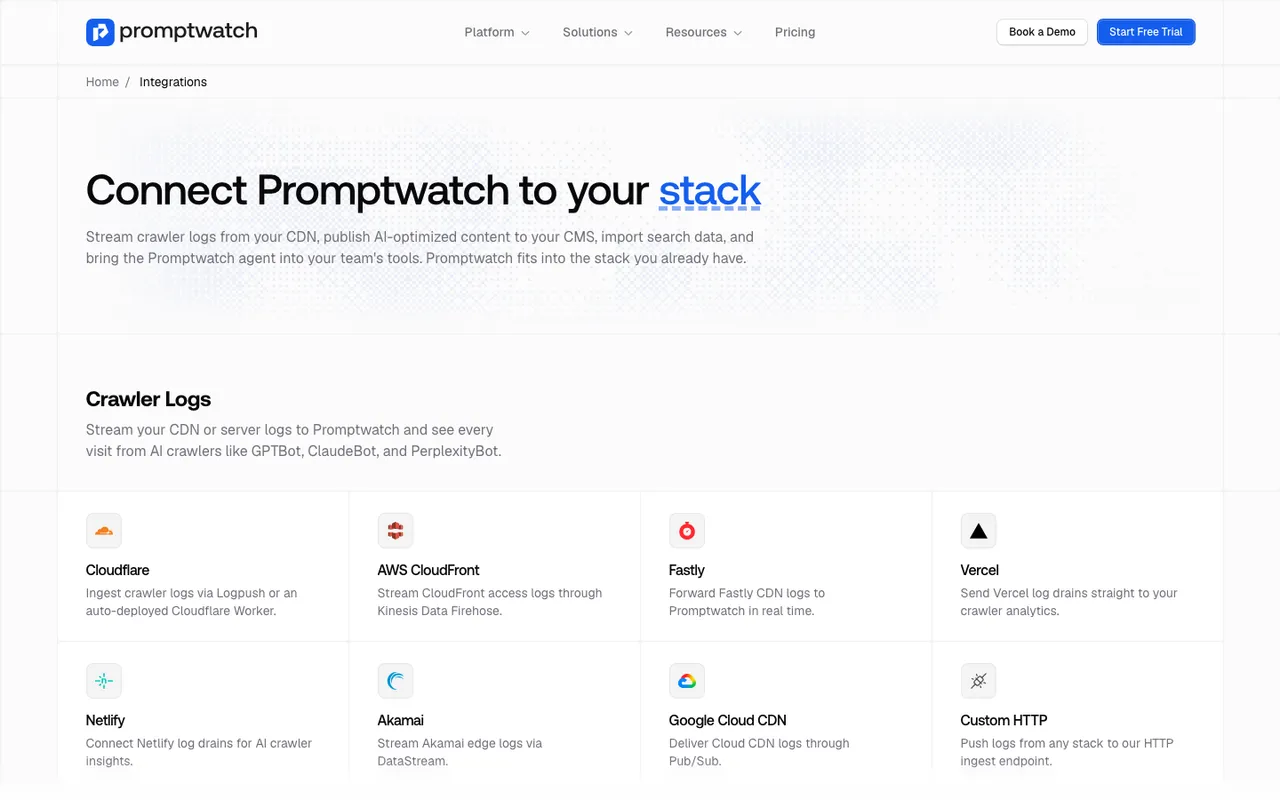 Promptwatch's Integrations page, captured November 6, 2026.
REST API v2
The REST API is on every paid plan. The base URL is https://server.promptwatch.com/api/v2, requests authenticate with an X-API-Key header, and date ranges can be up to 92 days per request. For a daily pipeline, that means a nightly job pulling yesterday's data, plus one-off backfills in 92-day windows.
API keys can be scoped to a project, to the whole organization, or to read-only access. Use a read-only key for any pipeline that only reads, so a leaked credential can't change monitors. On Business, Agency Scale and Enterprise, the audit log records whether each change came from the dashboard, the API, an MCP client or Agent Chat.
Rate limits scale with plan:
| Plan | Price | API requests per hour |
|---|---|---|
| Essential | $95/mo | 500 |
| Professional | $245/mo | 2,000 |
| Business | $579/mo | 10,000 |
| Enterprise | Custom | 50,000 |
| Agency Kick-off | $199/mo | 500 |
| Agency Growth | $399/mo | 2,000 |
| Agency Scale | $799/mo | 10,000 |
For most single-brand pipelines, 500 requests an hour is plenty for a nightly pull. It gets tight if you backfill many monitors at once or if several dashboards query the API live. Cache in your warehouse and let BI tools read from there.
Hosted MCP server
The MCP server at https://server.promptwatch.com/mcp exposes more than 110 read and write tools and connects with OAuth or an API key. It works with Claude, Claude Code, ChatGPT, Cursor, Lovable and Codex. This is the route for analysts who want to ask questions of the data in plain language ("how did our sentiment on Gemini move this month, and which responses pulled it down?") rather than write queries. Promptwatch also has an official ChatGPT plugin and an official Claude connector.
One published example: TreeHouse, the company behind Pararius and Huurwoningen.nl, automated its weekly reporting with the Promptwatch MCP, as part of work that made AI search about a quarter of its organic conversions. That's TreeHouse's result, but the reporting pattern is reusable. Write tools also mean an assistant can change monitors, so give the MCP connection a read-only key unless someone needs that.
Looker Studio connector
From Professional, and on every agency plan, a Looker Studio connector with templates feeds Promptwatch data straight into reports. For teams already on Looker Studio, this is the quickest way to a perception dashboard that leadership opens, and it avoids building a pipeline at all.
Exports
Excel and CSV exports with a column picker cover prompts, responses with brand positions, citations, crawler data, offsite mentions, content gaps, query fan-outs, and Reddit, YouTube, LinkedIn and Instagram citations. The responses export lists each brand mention with its position, in the form "Acme (1), Globex (2)", which is easy to split into rows. Exports suit one-off analysis and teams without engineering time.
A practical pipeline
A simple, reliable setup for a perception feed:
- A nightly job pulls daily Visibility, Share of Voice, Position and sentiment per monitor and per model for the previous day, using a read-only key.
- Store each row with its monitor, model, brand scope and date. Keep competitors in the same table so relative measures are possible later.
- Join on date and market to AI-referred visits and conversions (Promptwatch's Visitor Analytics covers these on every plan) and to your own CRM data.
- Alert when daily sentiment for your brand on any engine stays below 40 for several days, then have someone open Brand Narrative to read the claims behind it.
Step four matters. A warehouse can tell you that perception dropped. The reason sits in the claims and their cited pages, which is still a job for the app.
What other vendors publish
Using only our catalog entries:
| Tool | API | BI connector | Notes |
|---|---|---|---|
| Promptwatch | REST API v2 on every paid plan | Looker Studio from Professional | MCP server on every paid plan |
| AthenaHQ | Paid add-on on Starter, price on request | BI dashboards on Enterprise | CSV export on Starter |
| Scrunch AI | Enterprise only | Looker Studio on Enterprise | Core is $250/mo |
| Profound | Enterprise-gated | Not published | Trial and custom Enterprise only |
| Ahrefs Brand Radar | Not published in our catalog | Not published | Part of the Ahrefs suite |
"Not published" means our catalog entry doesn't cover it. If API access is the deciding factor, ask each vendor for its API documentation before the demo, not after.
Questions to settle before you sign
- Which metrics are available through the API, and are claim-level perception data and fact check results among them?
- What's the maximum date range per request, and the rate limit on my plan?
- Can I scope keys to read-only and to one project?
- Are metric definitions in the API identical to the ones in the app?
- Does the MCP server respect the same permissions as the user who connects it?
Where to start
For a BI team, Professional is the sensible first plan to test: it adds the Looker Studio connector and a 2,000-request hourly limit on top of the API and MCP access every paid plan has. Start Promptwatch's 7-day free trial on Professional, create a read-only key on day one, and see how much of your reporting you can build before the week is out.