Google AI Overview citation share, January to June 2026: what GEO software should show you
Six months of Promptwatch's AI Overview citation reports, from YouTube's lead to google.com's sixfold rise, turned into a checklist for buying GEO software.
A GEO tool that shows you one snapshot of which domains Google AI Overviews cites is showing you the least useful view. Promptwatch published six monthly citation-share reports for AI Overviews in the first half of 2026, and the clearest lesson from reading them side by side is that the source mix moves. YouTube stayed on top all six months. Reddit climbed after an early dip. Google's own domain went from a minor source to the third most cited. If your software can't put those months next to each other, per engine, it can't tell you any of that about your own category.
This guide walks through what the six reports say, what we think it means, and the checklist we would hand a vendor before signing.
What the six monthly reports show
Here are the three domains every report quotes, month by month. Each row links to the report it comes from, and each window is the full calendar month except June.
| Month and window | YouTube | google.com | Source | |
|---|---|---|---|---|
| January 2026 (Jan 1 to 31) | 2.32% | 1.69% | 0.37% | January report |
| February 2026 (Feb 1 to 28) | 2.25% | 1.65% | 0.74% | February report |
| March 2026 (Mar 1 to 31) | 3.69% | 1.98% | 0.89% | March report |
| April 2026 (Apr 1 to 30) | 3.77% | 2.25% | 0.61% | April report |
| May 2026 (May 1 to 31) | 3.74% | 2.52% | 1.15% | May report |
| June 2026 (Jun 1 to 27, month-to-date) | 4.16% | 2.72% | 2.30% | June report |
One footnote on the first row: the 0.37% for google.com in January comes from the comparison chart in the February report. The January page itself only quotes YouTube, Reddit, Facebook, and LinkedIn.
YouTube led every month. The big step came in March, when it went from 2.25% in February to 3.69%, which the March 2026 report calls a "64% jump" (Mar 1 to 31). After that it barely moved: 3.77% in April, then 3.74% in May. That small May slip isn't mentioned on either page; you only see it when you line the April and May reports up. In June it reached 4.16%, but that is a month-to-date figure for Jun 1 to 27 from the June report.
Reddit did not climb in a straight line. It slipped from 1.69% in January to 1.65% in February, per the February 2026 report (Feb 1 to 28). From there it rose each month and ended at 2.72% in the June report, again month-to-date (Jun 1 to 27). Some later report copy describes the climb as uninterrupted. The February number says otherwise, and that is a small example of why you want the raw series in your own tool rather than a narrative.
The google.com line is the one that should make any buyer pay attention. It was 0.37% in January and 2.30% in June (month-to-date, Jun 1 to 27), which the June 2026 report describes as "a sixfold increase in five months". It wasn't a smooth ride either: it fell from 0.89% in March to 0.61% in April before doubling from 1.15% in May. The same June report warns that "partial-month numbers can overstate momentum for fast risers like google.com", so read the last step with care.
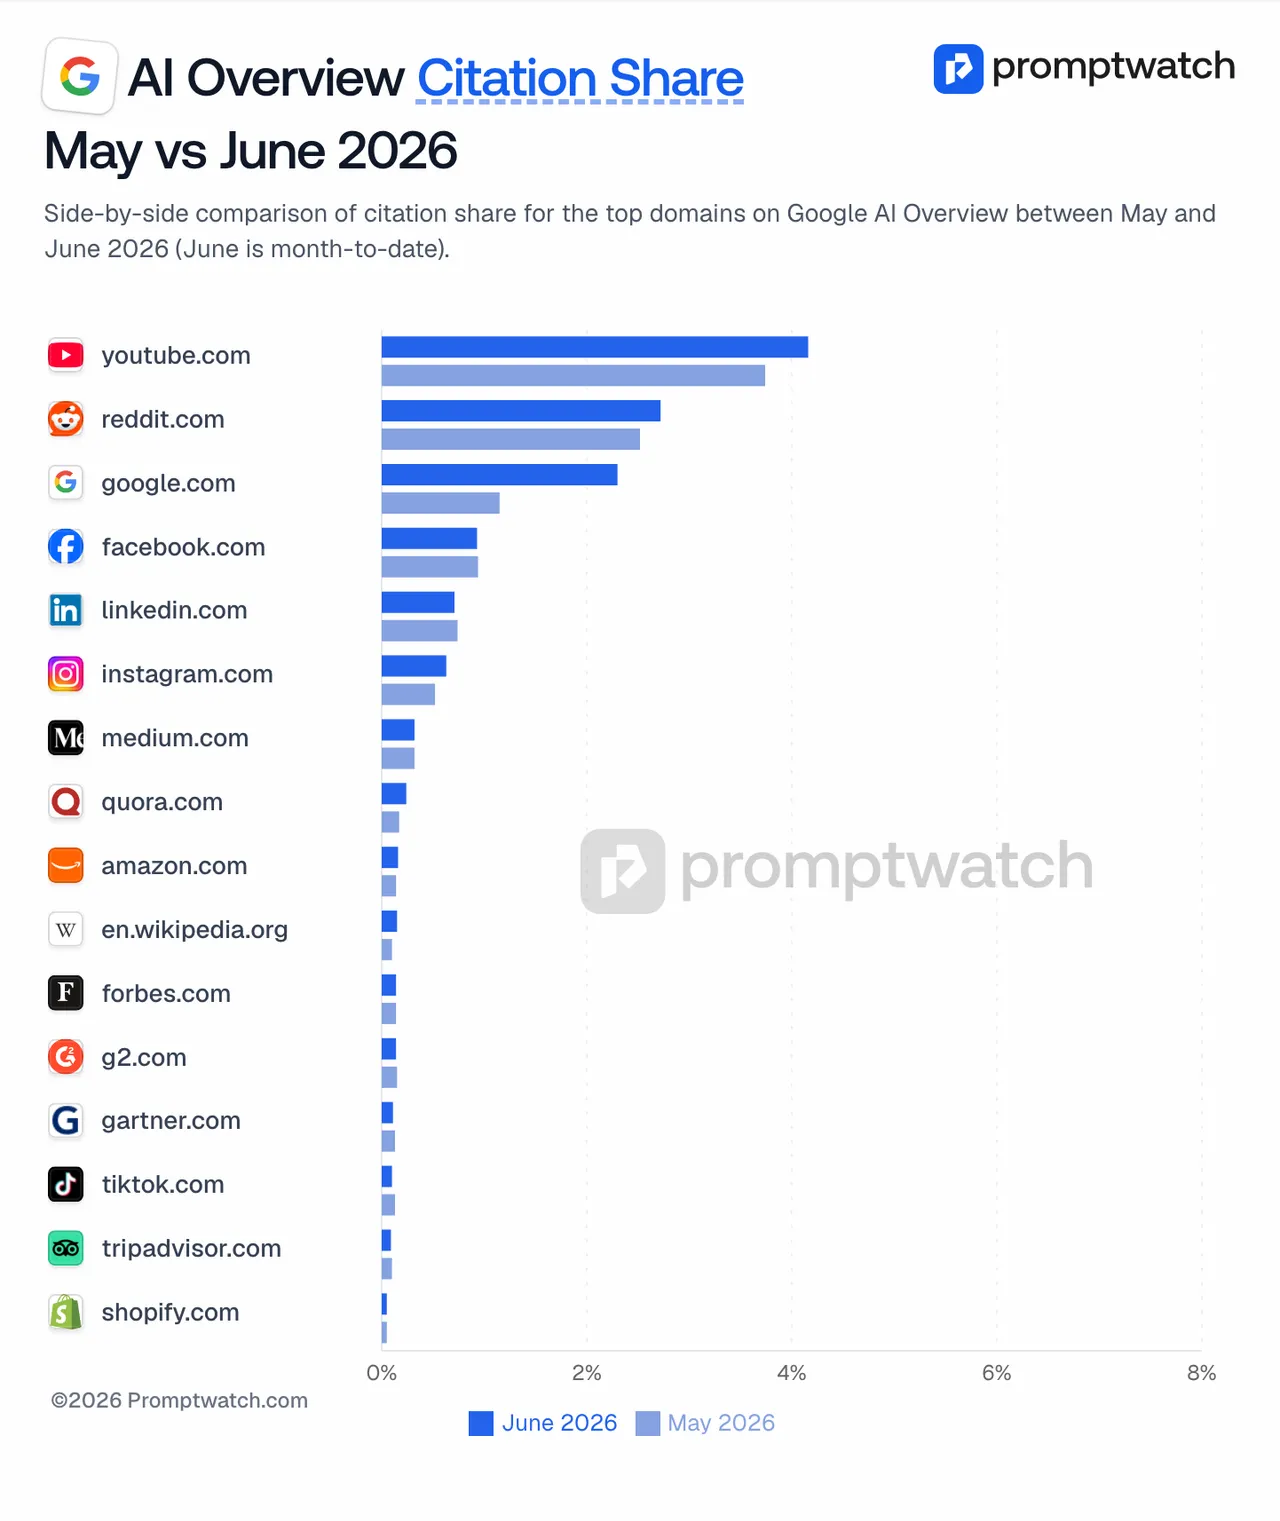 Promptwatch's "Google AI Overview Citation Share, May vs June 2026" chart (June is month-to-date, Jun 1 to 27), captured November 14, 2026.
Most citations go to domains no public chart lists
The bigger point hides in the totals. In April 2026 (Apr 1 to 30), all 16 domains in the chart together held "under 11%" of AI Overview citations, according to the April report. In May (May 1 to 31) the May report puts the 16 at "around 11%" and the rest at "~89%". Even YouTube and Reddit combined were "over 6%" in April, more than the next ten domains together, and still a small slice of the whole.
Our read: the domains you care about most, your own site and your direct competitors, almost certainly sit inside that remaining 89% from the May 2026 report (May 1 to 31). A public chart of the top 16 can't show them. That is the job of software running your own prompts.
March also shows how the head and tail trade places. The March 2026 report (Mar 1 to 31) titles its comparison "Big platforms surge as the long tail loses share" and adds that "almost nothing fell meaningfully" among the charted names. Instagram rose from 0.23% to 0.38% and TikTok from 0.06% to 0.15% in that same report.
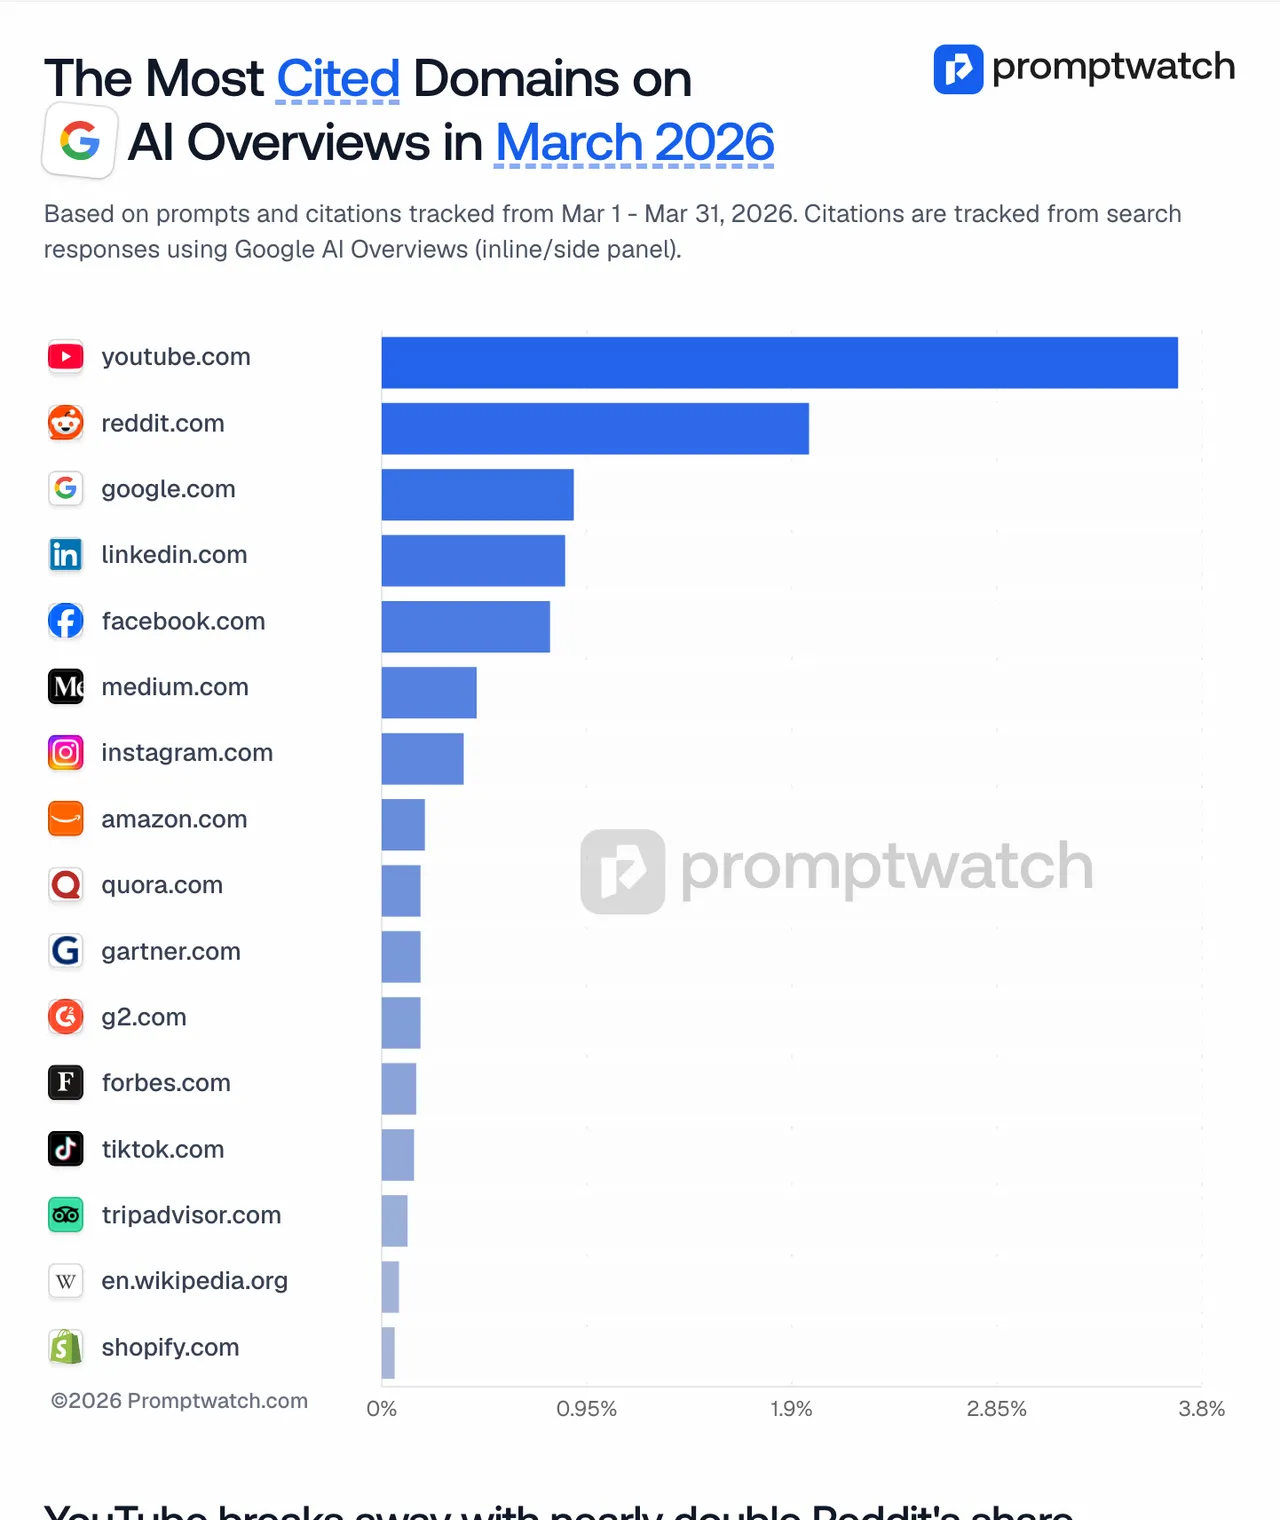 Promptwatch's "The Most Cited Domains on Google AI Overview in March 2026" chart, captured November 14, 2026.
Why this changes what you should buy
The reports carry their own warnings, and each one is a product requirement in disguise. The February page says "a domain's share can double or halve within four weeks." The April page says to "track your own citation share across at least two to three months before reallocating budget." The March page says to measure share "relative to competitors, not just in absolute terms."
Put those together and a minimum spec falls out. You need history, not a snapshot. You need per-month comparisons that don't mislead you about partial periods. You need competitor domains in the same view. And you need AI Overviews kept apart from Google AI Mode and ChatGPT, because the engines don't move together. Our AI Mode vs AI Overviews comparison covers how differently the two Google surfaces cite.
There is also a content-planning angle. YouTube was the top cited domain every month. If your category's AI Overview answers lean on video and you have none, a tool that only reports text pages will hide the gap. Our YouTube and AI search post goes deeper on that.
Checklist: what GEO software should show you
Use this when you sit through a demo. Ask the vendor to show each item live, on real data, not on a slide.
- Citation share by domain for AI Overviews specifically, as a line over time, with several months of history kept.
- Period comparisons that compare like with like. A "this month vs last month" view should use equal lengths, and a partial current month should say it is partial.
- Your domain and named competitors in the same chart, so you see relative share, the measure the March report recommends.
- Source-type grouping. Video, community, Google-owned properties, review sites, and your own site should be separable without exporting to a spreadsheet.
- A drill-down into social sources. If YouTube leads, you want to know which videos and channels, not just "youtube.com".
- Page-level tracking for your own URLs, so a gain or loss on one page doesn't hide inside a domain total.
- Exports and scheduled reports, because a monthly review only helps if someone actually reads it each month.
Questions to ask the vendor
- Do you capture Google AI Overviews from the live results page, or do you model it from an API?
- How often do my prompts run, and can I see each individual response behind a citation count?
- When I compare two periods, are they the same length?
- Can I filter citations by monitor, country, and prompt type, and save that filter?
- Which source and content types do you classify, and can I see a domain's trend inside one type?
- Can I track a specific competitor URL, not just their domain?
If a vendor hedges on the first or third question, keep looking.
How we would measure this with Promptwatch
We would start with Promptwatch, because it covers every line of the checklist in one place. Google AI Overviews is one of the engines it monitors through the real interface. Its citation analytics have three tabs, All Citations, URL Positions, and Citation Trends, each with a monitor filter. Citation Trends classifies every citation into 22 content types and 20 source types and shows citation rate by type over time, so a YouTube rise or a google.com climb in your own prompt set shows up as a trend line rather than a surprise.
For the YouTube question specifically, the YouTube citation report lists the videos and channels that get cited, with engagement. Page Tracker follows any URL, yours or a competitor's. The Citations dashboard tab added on November 13 puts cited domains, top cited URLs, and cited YouTube, Reddit, and LinkedIn posts on one fixed screen, and a scheduled report can follow that tab. The same release changed monitor comparisons so that a selected range is measured against a previous period of the same length, which is exactly item two on the checklist.
On brand plans, Search Insights sits next to this and overlays Google Search Console and Bing Webmaster clicks and impressions on AI crawls and citations, per page and topic. That helps when you are trying to tell whether an AI Overview citation came with a classic search click.
 Promptwatch Academy's "Understanding sources" page, captured November 14, 2026.
Pricing is public. Essential is $95 a month with 50 prompts and daily tracking. Professional is $245 a month with 150 prompts and adds crawler logs and custom reports. Business is $579 a month and adds faster tracking and state and city targeting.
How the alternatives line up, using what our catalog lists: AthenaHQ starts at $295 a month on Starter and covers 11 models with country-level support. Scrunch AI Core is $250 a month and tracks four engines, including Google AI Overviews. Ahrefs Brand Radar covers AI Overviews in its AI Visibility Index from $199 a month, with index question sets retested monthly, which suits directional research better than prompt-level tracking. None of the three entries in our catalog lists the combination of citation trends, crawler logs, and AI-referred traffic that Promptwatch has.
Where to start
Read the June 2026 report and the rest of the series on the data index for the market view. Then put 30 to 50 of your own buyer questions into a monitor and see which domains AI Overviews actually cites for your category. Promptwatch's 7-day free trial on monthly billing is long enough to collect a first week of daily data and decide whether the domain trends in your niche look anything like the public ones.